A few weeks ago our CFO asked me what makes the move to agents so hard for some of our engineering teams. Months of GitHub data and pages of analysis fit in one line: it is the step where people go from “Claude writes code I review” to “I write the workflows that Claude runs.”
I have been thinking about that line ever since, because it reaches every function, not only engineering.
Bell curves and long tails
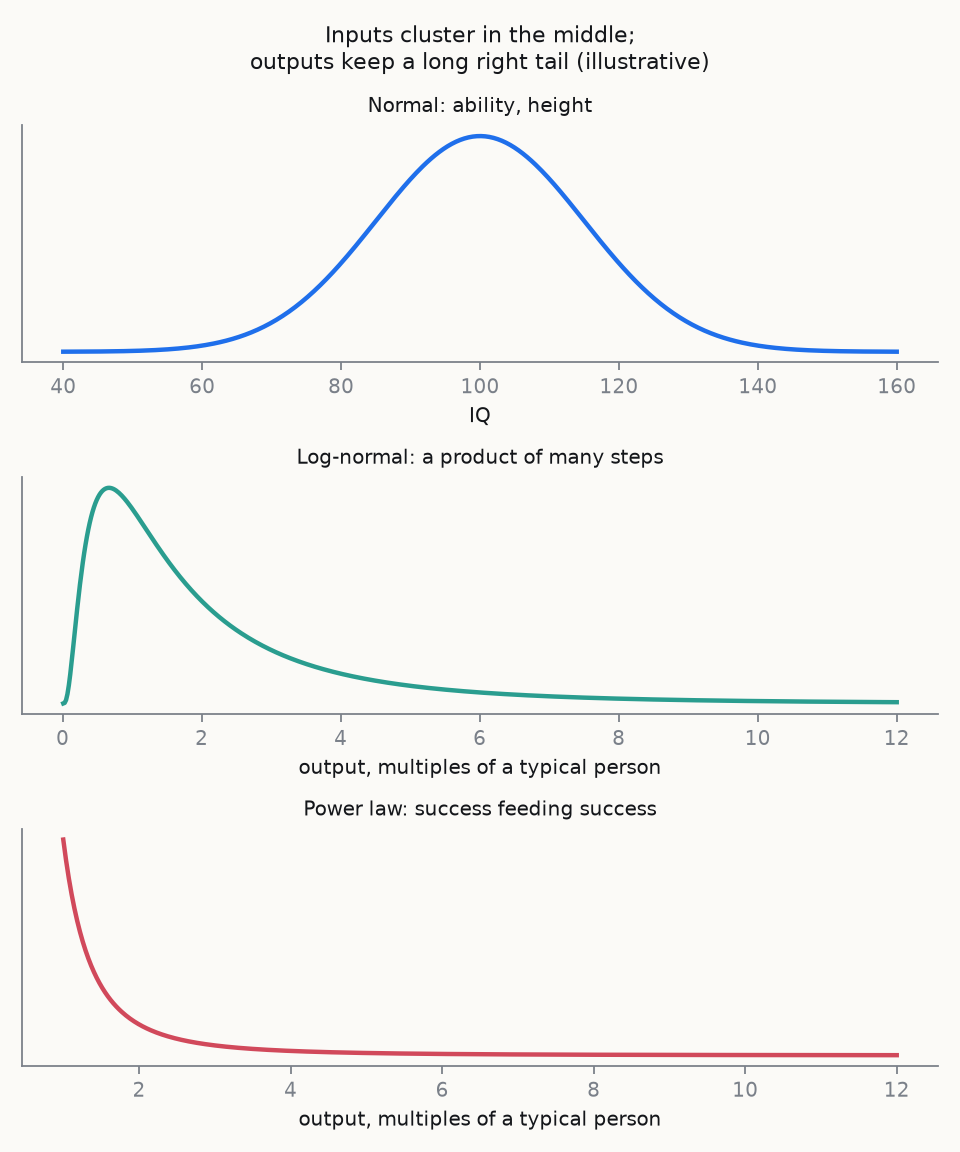
IQ (Intelligence Quotient) is normal, partly by construction: tests are scaled to a mean of 100 and a standard deviation of 15. Even before scaling, though, raw ability looks roughly normal, just like height, because it is shaped by the sum of many small, independent factors, genetic and environmental, and the central limit theorem says that sums of many small effects converge to a bell curve. The consequence is that extremes are rare and bounded. About 2% of people are above 130, and someone at 160 is about 1 in 30,000. And most importantly, nobody is ten times as intelligent as the median person. Add the tallest person in the world to a stadium full of people and the average height barely moves, which is what Nassim Taleb calls Mediocristan.
Work output is different.
Papers published, sales closed, code shipped, wealth: these are heavy-tailed, and the best are routinely 10 or 100 times the median. That’s Taleb’s Extremistan. Add one billionaire to the stadium and the average wealth changes completely.
Two mechanisms produce the heavy tail.
- Multiplication gives a log-normal. In 1957 William Shockley (yes, the transistor one, who had led a group at Bell Labs) looked at the publication records of research laboratories such as Los Alamos and Brookhaven, and asked why some scientists published fifty times more than others. His answer was that getting a paper out means clearing a chain of hurdles, from having the idea to getting it written up and published. Output is the product of how good you are at each step. A person who is modestly better at each of eight steps, say 1.5 times, ends up about 25 times more productive overall. The logarithm of a product is a sum, so the central limit theorem now applies to the logs, and the result is a log-normal. Inputs that are normal, multiplied together, give outputs that are heavy-tailed.
- Feedback gives a power law. Success brings resources, attention and better problems, which bring more success: the rich get richer. Robert Merton called it the Matthew effect (1968), and Herbert Simon (1955) and later Barabási modelled it as preferential attachment. Processes like this produce power laws (Pareto).
Jobs where one person’s output is capped by their own hours produce normal-looking results. Jobs with leverage, where tools, capital or other people multiply what one person does, produce heavy tails. A craftsman’s output is capped by their own attention. A factory removes that cap.
Agents and the leveraged log-normal
A month after we reorganised engineering into small crews, I looked at who had written what. In that month, two of the engineers on the crew roster, 3% of them, wrote half of all the pull requests, and about one in six wrote four fifths.
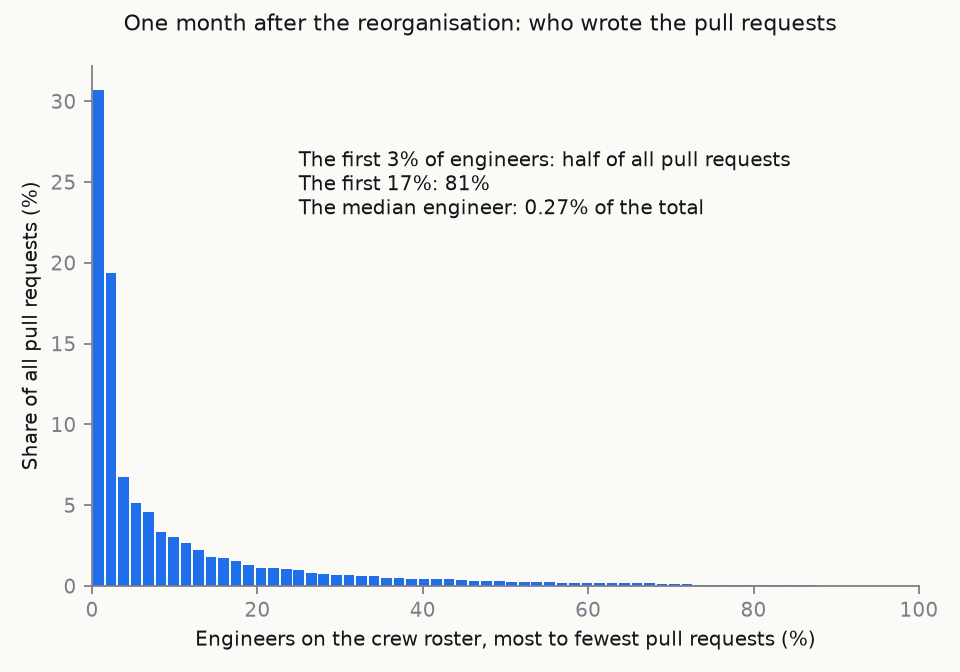 The median builder went from 0.44 pull requests a day over the previous twelve months to 0.50, which is to say that the typical engineer works much as they did a year ago, while the output of the team has multiplied.
I checked it against the same month a year earlier, for the same engineers. The total had grown almost sevenfold, while the median person only went from 10 pull requests a month to 17. The two people at the top of this year’s curve had multiplied their own output more than sixtyfold.
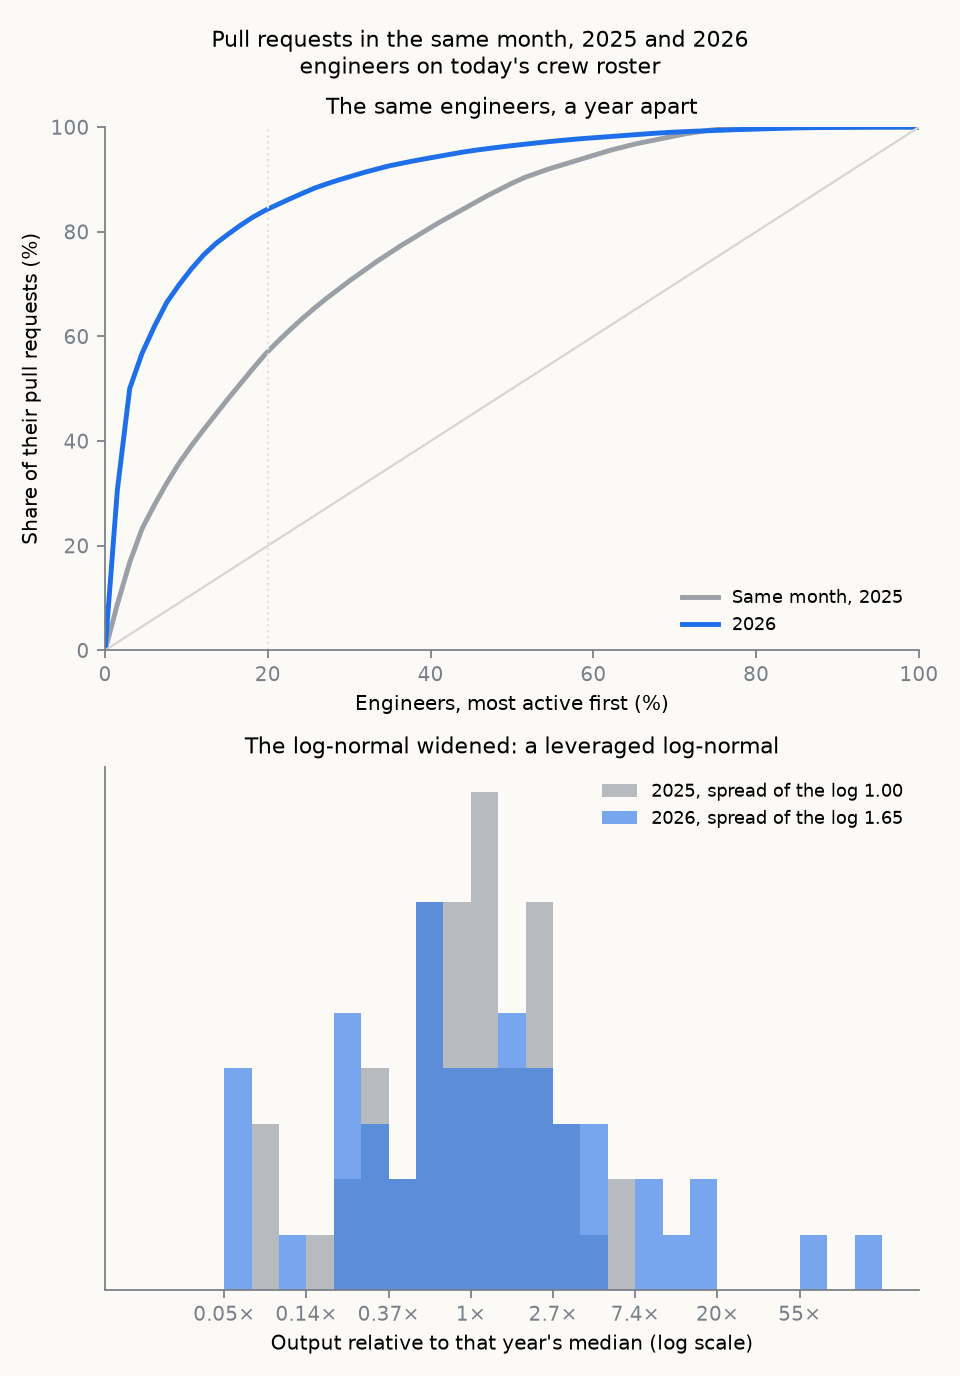
Talent has always been steeply uneven, and every manager has worked around it for years. What agents have done is remove the ceiling of one person’s attention, so that a curve which was always there is now steep enough to be clearly visible.
Pull requests are volume, and not value, and agents inflate them. By a lot. But a gap of a hundred times is not a measurement problem, and the interesting question is what the people at the top are doing that the others are not.
The answer is not that they use agents more, nor better. My reading is that they use agents to improve every step of the process at once, and that the gains compound. Just as in Shockley’s model, a process of eight steps where each step becomes 50% better ends up 25 times more productive.
That is the shape I would call a leveraged log-normal: still a log-normal, a product of many steps, but one whose spread widens as each person’s leverage grows. Among the engineers who opened pull requests in both years, the spread of the logarithm of their output went from 1.0 to 1.65. A year ago someone one standard deviation above the median produced about 2.7 times the median, and now they produce about 5.2 times. The median barely moved while the tail stretched.
The curve is also consistent with feedback. Craftsmen with agents multiply their own steps, which gives a log-normal, while Factory Builders gain from everyone else shipping through what they built, which is how a power law forms. With so few people in the tail, a log-normal and a power law fit our data equally well, so I will not claim which one we are looking at.
Craftsmen and Factory Builders
I spent years at Yahoo in what I once described as a school of craftsmanship. Engineers showed off their prowess in libraries, code and releases, juniors looked up to seniors to learn the trade, and the only way to make progress in that culture was to be admired through code. I loved it, and I still “bleed purple”.
An agent in the hands of a craftsman is a better tool. The piece gets written faster, reviewed and admired, and the gain ends where one person’s attention ends. I call this person the Craftsman, and most engineers today are Craftsmen, some of them exceptional.
The people at the top of the curve have stopped making pieces. They build the machine that makes the pieces, and then other people and other agents run it all night. I call them Factory Builders, and the test for one is simple: do other people ship through what you built? A thousand changes that only their author ever reads is a very fast Craftsman, while a harness that another team adopts is a factory.
In 2022 I wrote that we did not want to scale with Generals, but with Heroes. I still believe it, and I now know what the Hero does all day.
The Hero builds the factory.
Where the curve is steep
A colleague asked whether the curve shows up everywhere, so we ran it on every pull request that our three GitHub organisations received in that month, with bots left out. A century ago Lotka found that the number of scientists publishing n papers falls as one over n squared, and Price later proposed that about the square root of the number of authors in a field write half its papers. Later studies found even Price’s rule too gentle, and our curve is steeper still: for a team our size it would predict roughly an eighth of the engineers, whereas for us it took 3%. Across the company, the most active fifth of authors wrote 82% of the pull requests and the bottom half wrote 4%. In each of our four engineering domains the top fifth wrote between 70% and 94%.
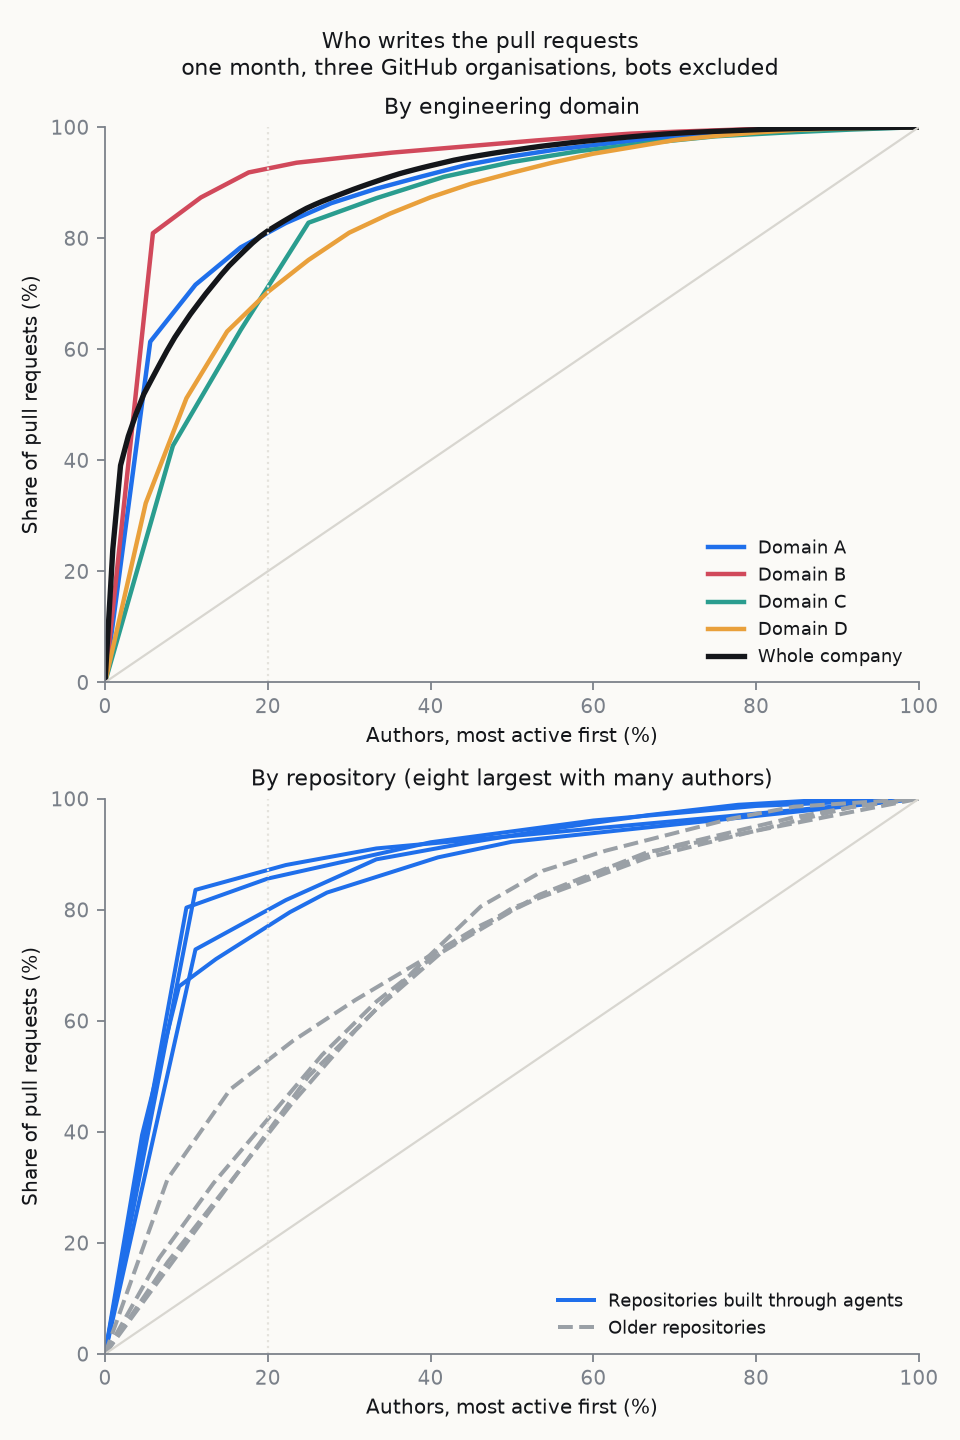
Inside the repositories, though, the curve splits in two. Where the work runs through agents, one or two people wrote two thirds or more of everything that landed. In the older repositories, the top fifth wrote about half and the bottom half wrote up to a fifth, which is how work was spread before agents. Measured as a Gini coefficient, the agentic repositories sit around 0.7 to 0.8 and the legacy ones around 0.4.
The history of a single repository tells the same story. Our newest product has been built by people and agents working under one shared doctrine for thirteen months, and in that time it has taken almost as many commits as our platform monorepo gathered in eleven years. Commits are volume too, but eleven years of history in a little over one is what a factory looks like from the outside.
It is not just engineering
Our finance automation team set out to run the monthly close, for the first time, on revenue that comes out of a model in the warehouse rather than a spreadsheet. In their status note there is a small exchange I keep coming back to. Finance asked how the model treats a refund on a prepaid plan, and the engineer answered that there was no rule yet, and that whenever finance defined one they would turn it into the model.
That is the new job. Instead of producing the number, the finance expert defines the policy that produces every number, and the time that comes back goes to what we never had the capacity to do: reconciliation we can trust, and planning that looks forward instead of backward.
Sales has built a prospecting tool, operations a production trace, partner operations a portal that adds cameras unattended, and marketing a brand panel. Every one of these started with a domain expert who got tired of doing the work by hand.
Making it visible
So the bar is the same for every one of us, in every function and at every level, starting with leadership: build something others ship through, or ship through what somebody else built.
To make it visible, we grade functions rather than people. A leaderboard counts the work that other people do in the apps each function built, what runs on a schedule, and what is wired to the systems the company runs on, and it names each function’s next step. For engineering, each person sees their own profile and where they sit in their crew, and nobody else’s. We read all of it as a direction rather than a measurement, because the numbers count volume and adoption far better than they count value.
This is a leap, and I know it. We are asking finance experts, marketers and firmware engineers to work the way a handful of people have shown is possible, on the strength of a few months and a few stories. But the people at the top of the curve did not wait for a structure that allowed them to work this way.
Go build your factory.
Further reading.
- William Shockley, “On the Statistics of Individual Variations of Productivity in Research Laboratories”, Proceedings of the IRE 45(3), 1957.
- Alfred J. Lotka, “The Frequency Distribution of Scientific Productivity”, Journal of the Washington Academy of Sciences 16(12), 1926.
- Derek J. de Solla Price, Little Science, Big Science, Columbia University Press, 1963.
- Herbert A. Simon, “On a Class of Skew Distribution Functions”, Biometrika 42(3/4), 1955.
- Robert K. Merton, “The Matthew Effect in Science”, Science 159(3810), 1968.
- Albert-László Barabási and Réka Albert, “Emergence of Scaling in Random Networks”, Science 286(5439), 1999.
- Nassim Nicholas Taleb, The Black Swan, Random House, 2007.
- Ernest O’Boyle and Herman Aguinis, “The Best and the Rest: Revisiting the Norm of Normality of Individual Performance”, Personnel Psychology 65(1), 2012.
- James W. Beck, Adam S. Beatty and Paul R. Sackett, “On the Distribution of Job Performance: The Role of Measurement Characteristics in Observed Departures from Normality”, Personnel Psychology 67(3), 2014.
- Aaron Clauset, Cosma Rohilla Shalizi and M. E. J. Newman, “Power-Law Distributions in Empirical Data”, SIAM Review 51(4), 2009.