This blueprint helps understand why we work on certain things, and why we work on it now. But in addition to this it’s important to also be able to justify the priorities of what we work on. More precisely what’s the allocation of relative effort and time we should put in one feature vs another.
A highly pretentious model to understand product prioritisation
What we do at Nexar falls into three buckets:
- Be the best dash cam service in the world
- Grow a massive network
- Unlock the power of the network to protect our users and grow a lasting business
One possible conceptual model to explain and justify investment (effort and time) is based on looking at how to optimise the positive externalities of the network.
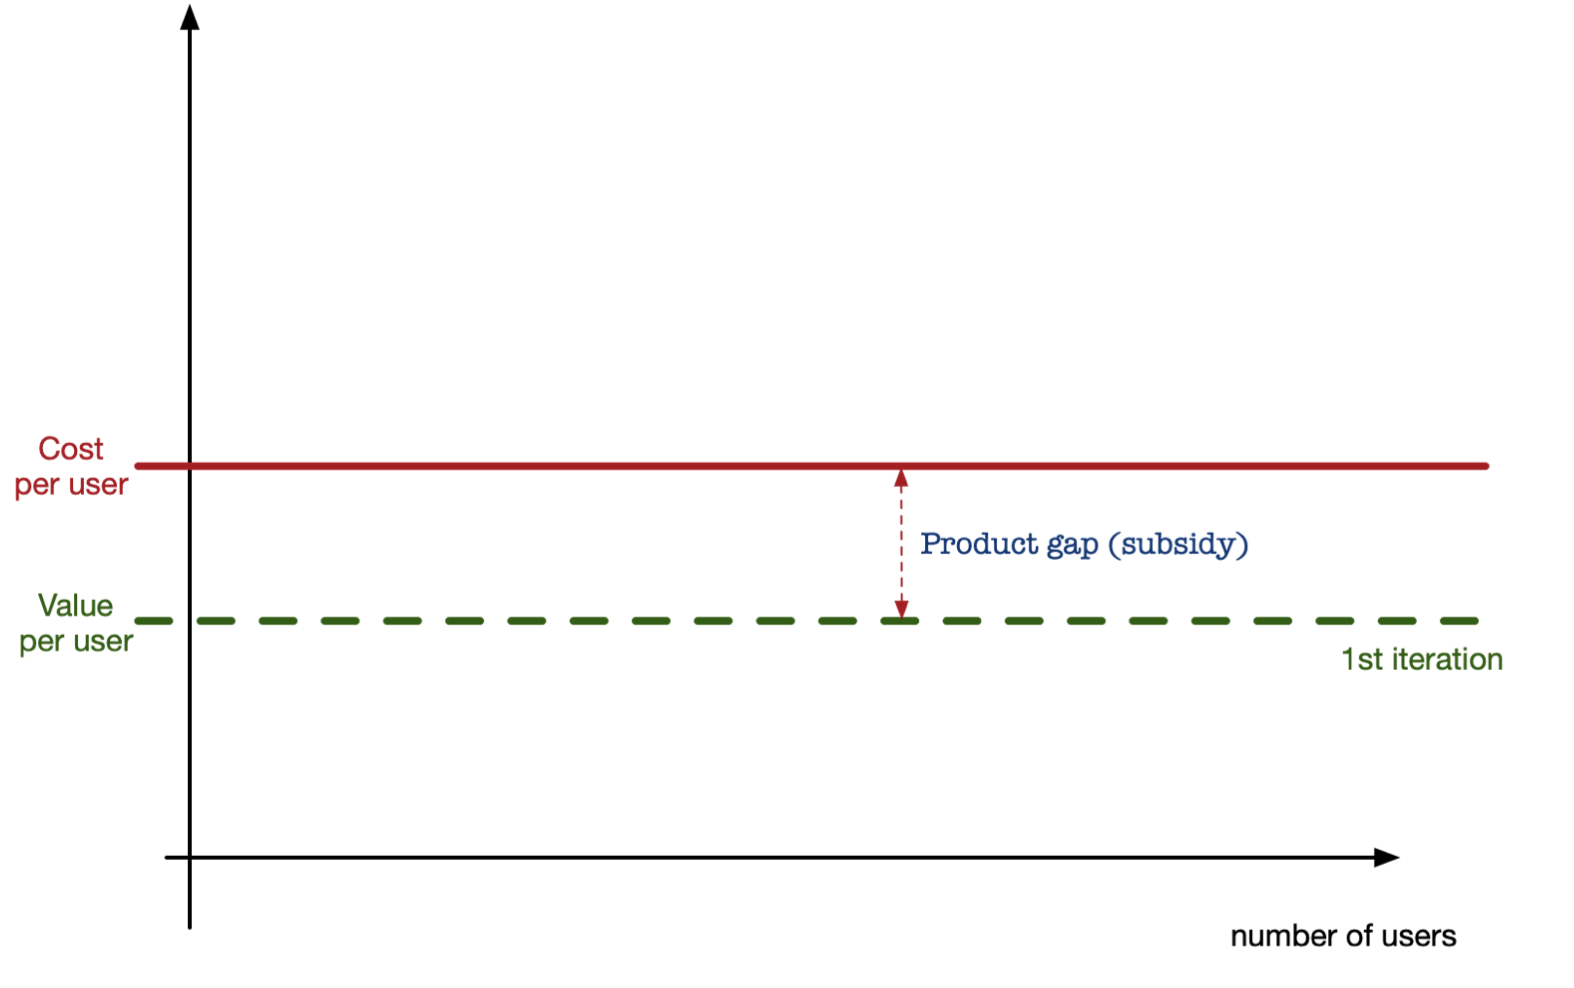
When we look at a product without any network effects, for example a traditional dash cam going into the car dashboard, then the value the user gets out of the dash cam is independent of the number of users that bought the camera. Whether you drive alone using the camera, or you, your buddies and your neighbours use this or any other camera, does not change the product value you get out of the camera. Although I am referring here to value, which has a market price associated with it and hence can be compared with cost, in reality we should be talking about utility, which is the personal gain the user gets out using the product, based on the choice to purchase this product, and for which cost is just one more attribute contributing to the overall utility.
As we start building a dash cam (in “single player mode”), we find that perhaps we don’t have product market fit yet. In this case, the cost for the company to produce and sell the dash cam is higher than the value the user gets out of it. If we want users to drive with the dash cam we need to subsidise usage to bridge the gap between value and cost. And as adoption increases, the subsidies per user remain constant. This barrier prevents growth from happening.
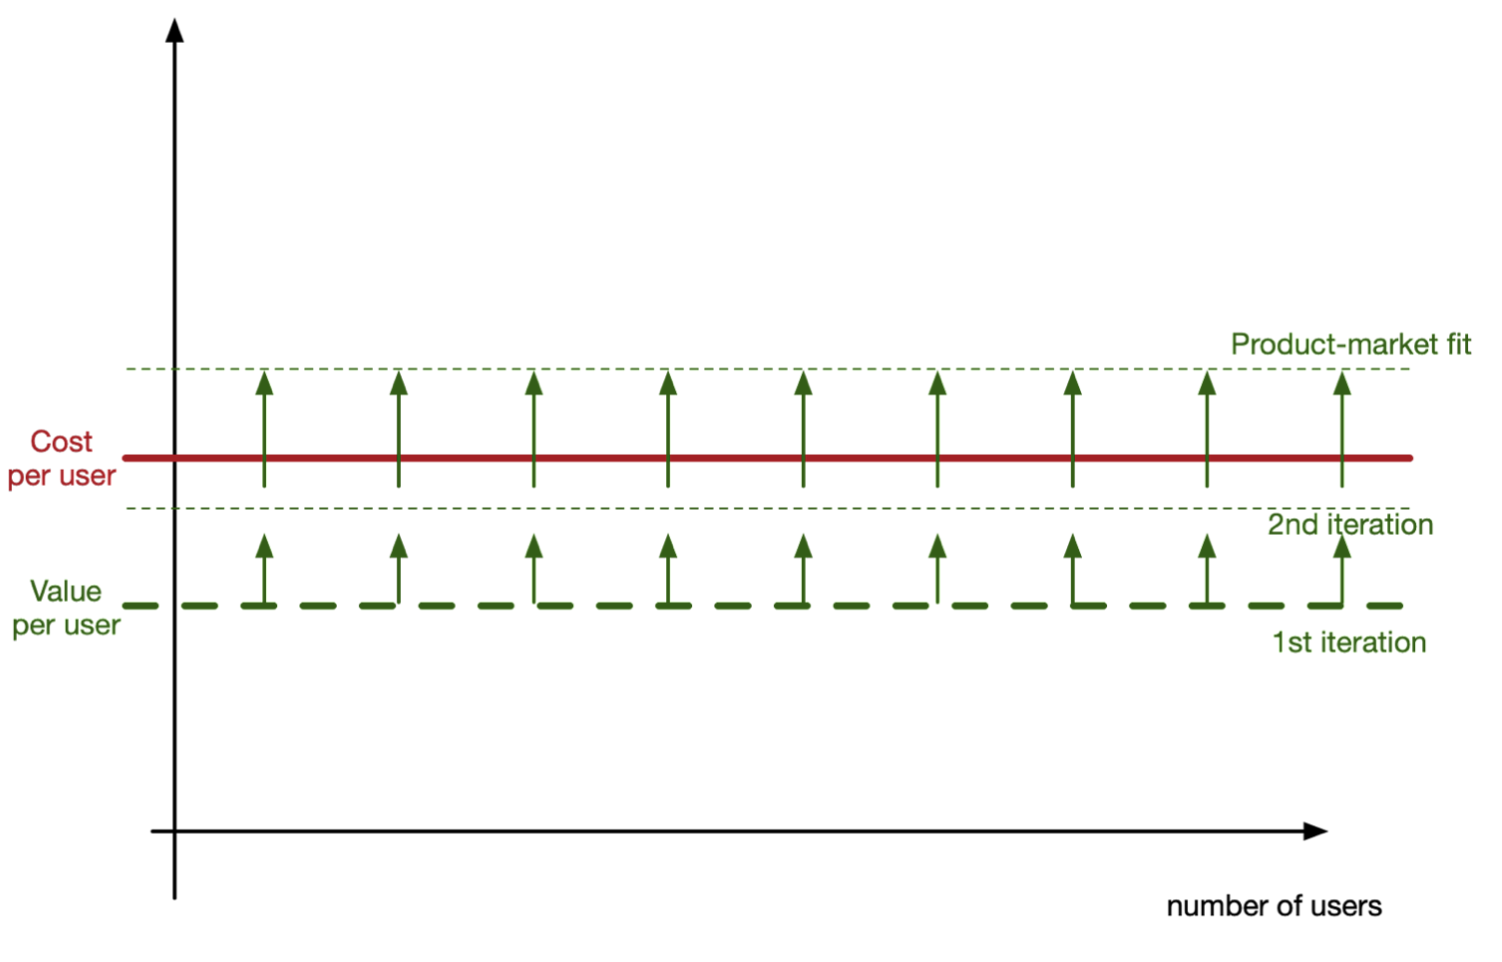
The only work to increase product value is to make the camera “better”, till the point where we reach product-market fit and the value to the user is higher than what it costs us to produce the camera.
Now, with this single player mode model in mind, we can start to see how a product that builds a network plays out. When the first user joins in, the value she gets is equal to the single player mode. As the number of users grows, the value of the network grows.
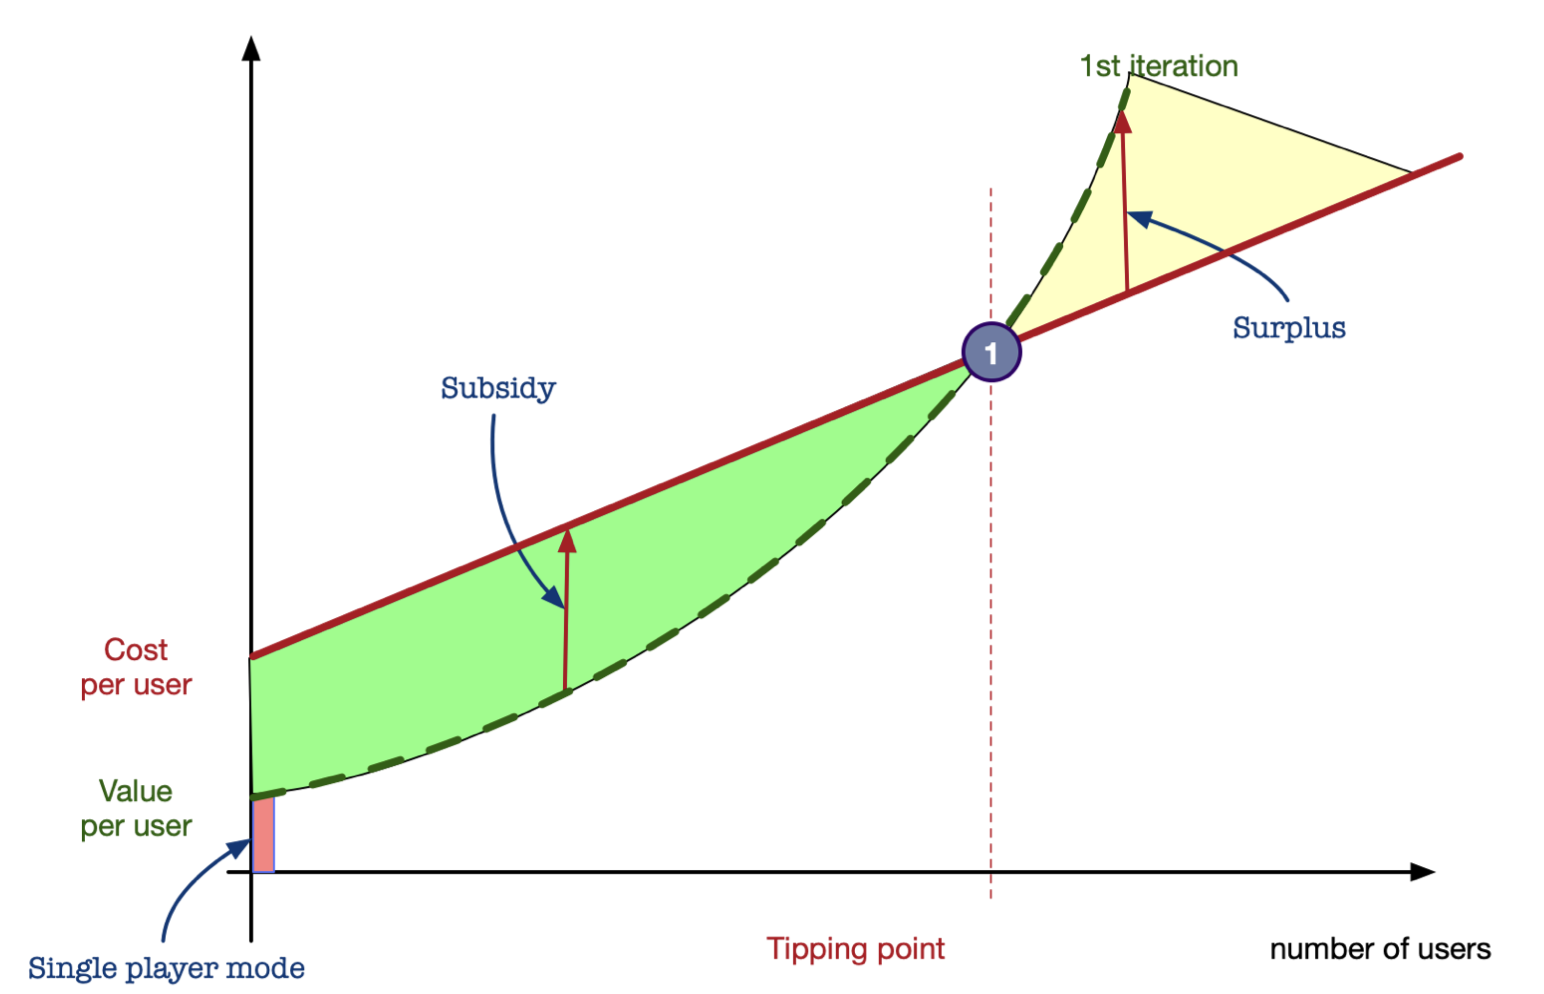
The way this works is through “positive externalities”. As I (1st party) use the network that Nexar (2nd party) provides, the data that I collect and share with other users (3rd party) helps them drive safer on the road. This economic benefit to the 3rd party not involved in the transaction user <> Nexar is referred to as positive externality. In the case of a product the leverages network effects to create user value, the more users in the network the higher value because of the positive externalities. Specifically in the case of networks, the value of the network is proportional to n2, the square of the number of users in the network (Metcalfe’s law, since the number of connection is n(n-1)/2).
On the cost side, there is an initial cost per user required to produce and provide the “best dash cam service in the world.” As the number of users increases, cost remains almost flat, although it could increase slightly due operational scaling costs.
What we then see is that until we achieve certain network size, we have to subsidise users to join the network, as the value they get out of the service is less than what it costs us. Once the value equals the cost, we start to generate a surplus, and from that point on, any new user generates more network externalities than it costs us, and subsidies are no longer required.
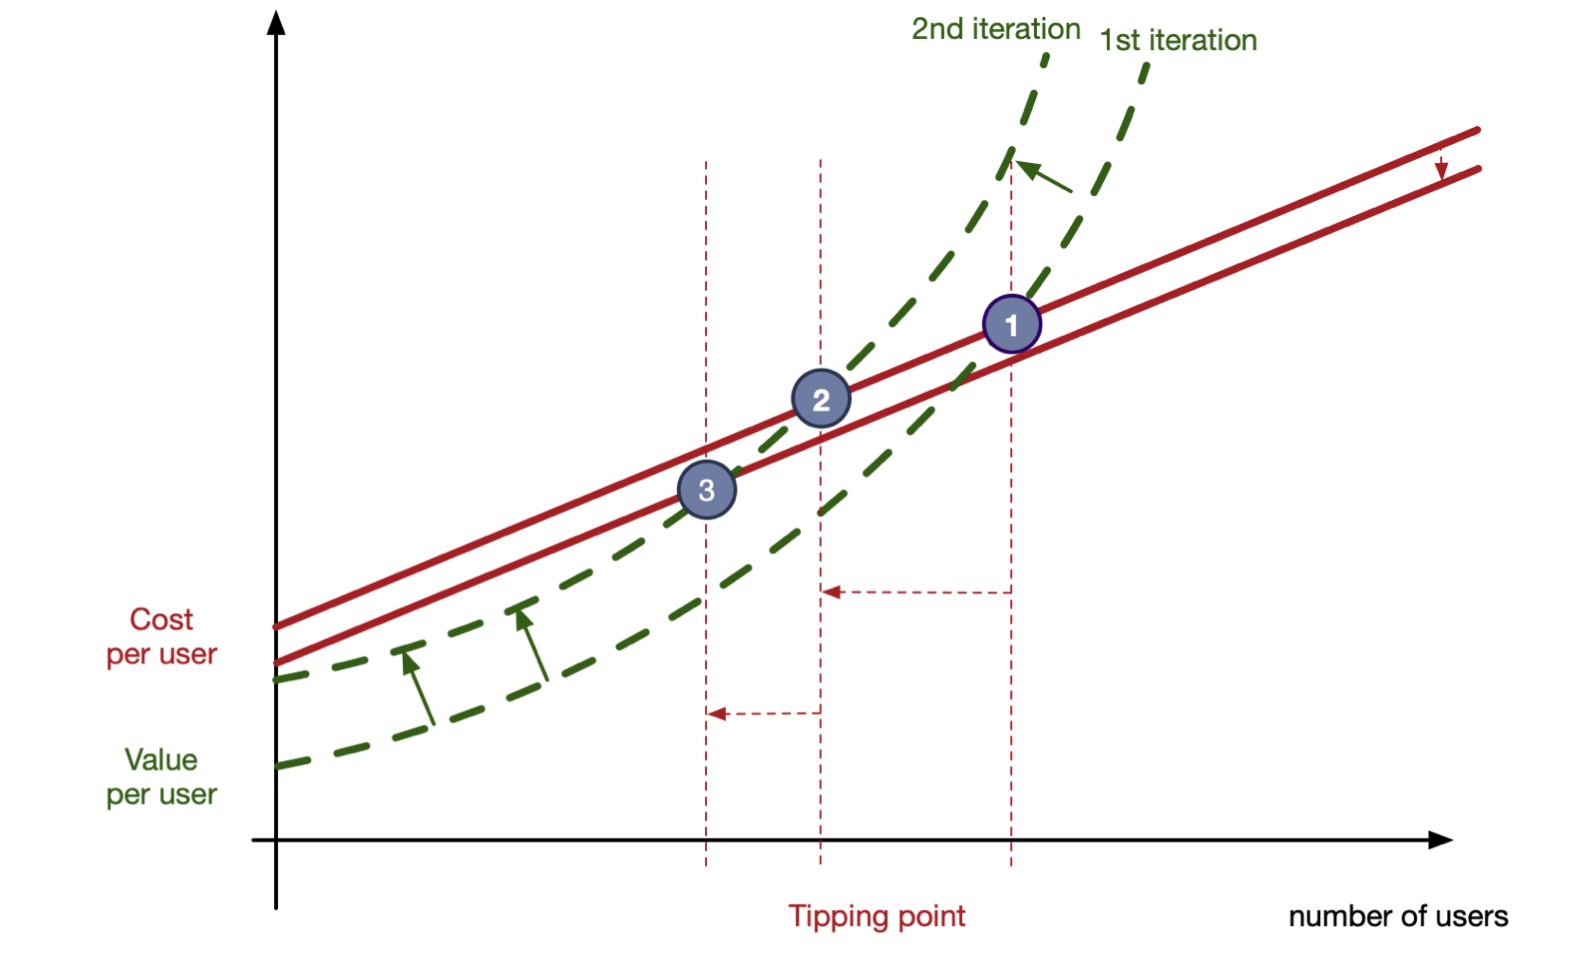
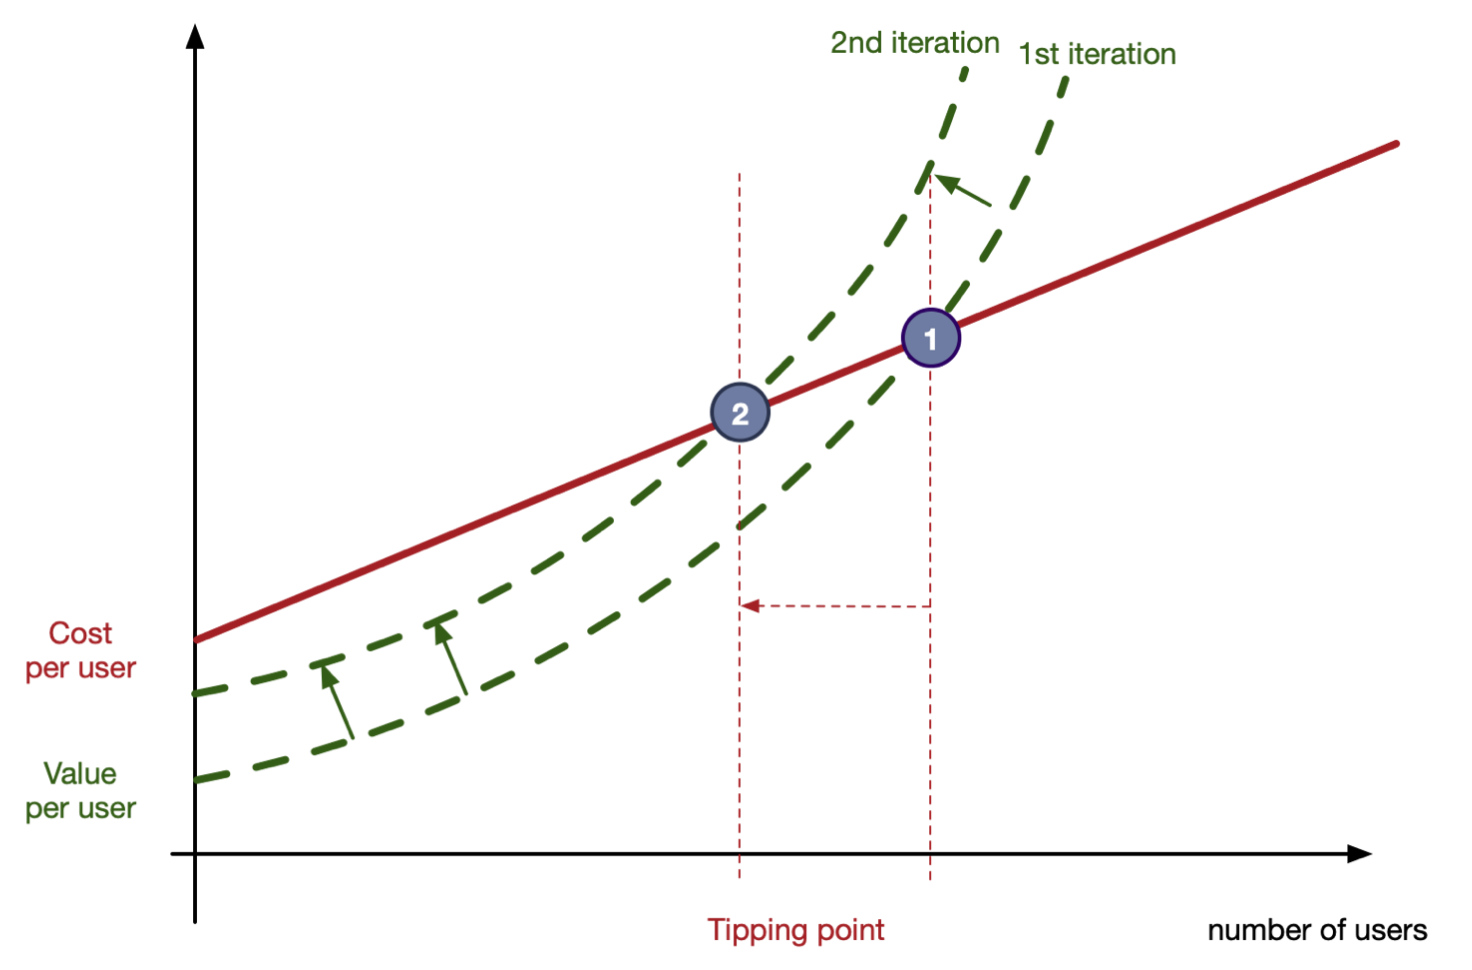
As we work on things that make the “best dash cam service in the world”, we are shifting the value curve upwards, parallel to the original curve. By doing this, we can reach a tipping point earlier (1 to 2), requiring less users.
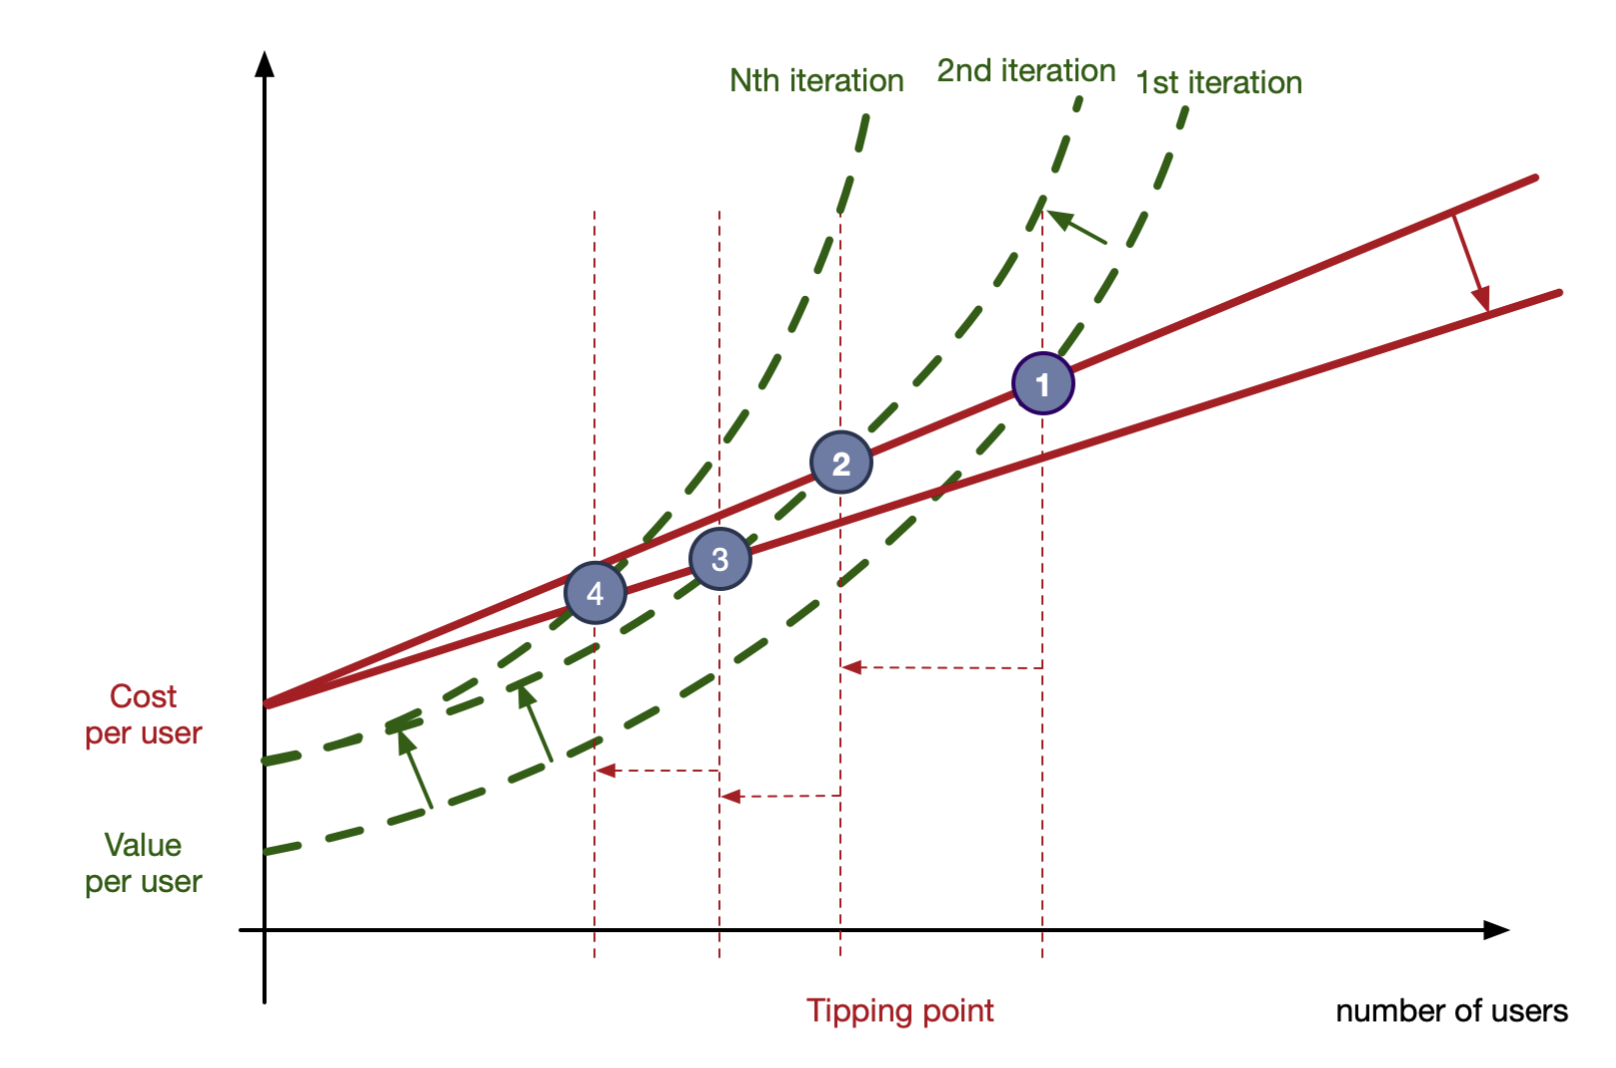
The other thing we can do is reduce our fixed initial cost, so that it becomes cheaper to “grow a massive network,” also moving the tipping earlier (2 to 3).
Finally, we can also change the shape of the value curve to grow faster (3 to 4), even exponentially rather than quadratically (Reed’s law), by “unlocking the power of the network.”